The current situation
Less rain but more extreme downpours
While Australia’s rainfall varies from year to year and is influenced by climate cycles such as El Niño and La Niña, longer-term trends are apparent. The southern regions of Australia, are experiencing the biggest large-scale reduction in rainfall since national records began in 1900.1
South-east Australia had below-average rainfall in 16 of the last 20 growing seasons.2 In that time, the changing climate conditions reduced wheat yields in Victoria by nearly 15 per cent compared with long term conditions.3
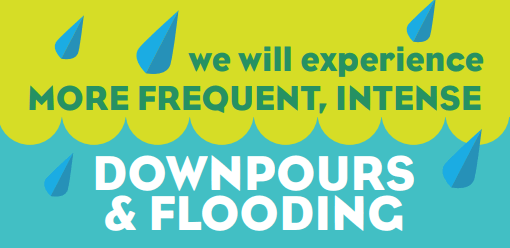
As the climate changes, it is predicted that Victoria will experience more frequent, intense downpours and flooding.4
Sea levels have risen by about 20cm since the mid-19th century and will continue to rise as a result of climate change.5
Living in a hotter climate
The frequency and intensity of heatwaves is increasing in Victoria. There has also been an increase in the intensity of fire weather and a longer fire season in the south-east of Australia.6
In the ten years since 2005, Victoria has experienced more days of extreme heat than the 30 years spanning from 1910.7
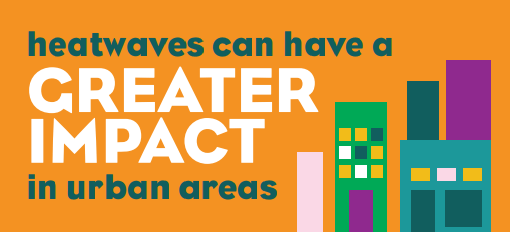
Heatwaves can have a greater impact in urban areas because concrete, stone and road surfaces absorb greater amounts of energy from the sun. Exposed urban surfaces can heat to temperatures up to 50°C hotter than the air while surfaces in rural areas remain close to air temperature.8
High greenhouse gas emissions
Victoria’s per capita greenhouse gas emissions are among the highest in the world. Victoria produces approximately 20 tonnes per person while the global average is around five.9
Urban areas are instrumental in reducing emissions as they account for around 70 per cent of global energy emissions.10
Total greenhouse gas emissions for Victoria are 119.6 million tonnes per year. Most emissions come from stationary energy, which includes electricity, gas and other industries that involve the burning of fossil fuels.11
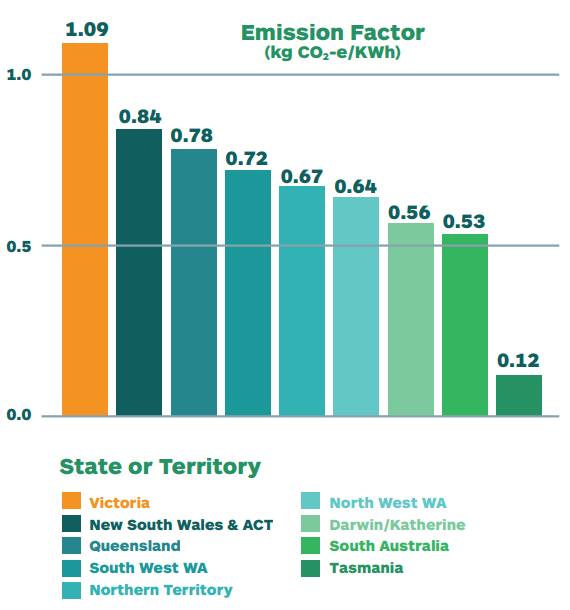
Victoria currently has the most emissions intensive power generation infrastructure in the country.12
Many homes are not energy efficient
While all new homes in Victoria must comply with the compulsory six Star House Energy Rating, around 86 per cent were built before stronger energy efficiency regulations were introduced in 2005. As a result, the average rating for houses constructed in Victoria before 2005 is 1.81 stars.13
Retrofitting existing homes to improve energy efficiency can reduce emissions by up to 3.4 tonnes per household per year.14
Generating electricity from renewable sources

In 2016, 16 per cent of electricity in Victoria was generated from renewable sources. Tasmania generated 93 per cent and South Australia 48 per cent. Overall, renewable energy supplied 17.3 per cent of Australia’s electricity throughout the year–enough to power the equivalent of almost eight million average homes.15
Residential solar power
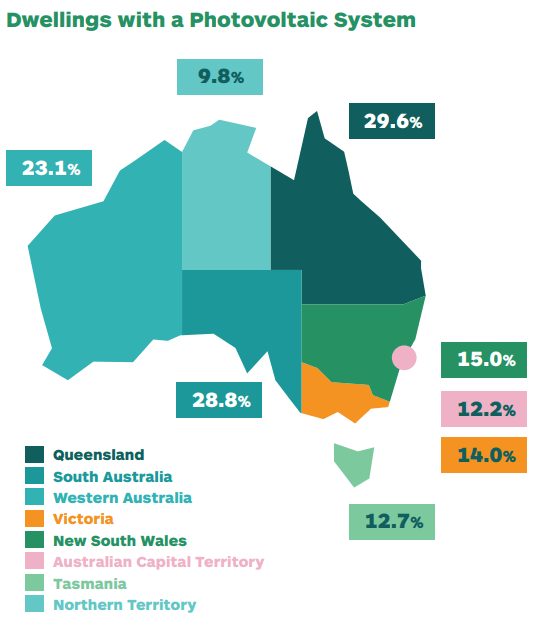
Rooftop solar systems have been installed on 14 per cent of homes in Victoria.16 Installations are rapidly increasing as solar prices fall and grid electricity prices rise.
Melbourne's air quality is good
Melbourne’s air quality is better than or comparable to other similarly sized cities, and has improved significantly in recent decades.17
Pollutants in the air can be due to human activities, such as:
- vehicle emissions
- industrial processes and wood heaters
- natural events including bushfires, strong winds and pollen.18
Our waste is growing
Most waste produces greenhouse gas emissions in landfill and other waste facilities. As Victoria’s population grows and consumption patterns change, the amount of waste being generated is also increasing.
At the current rate of increase, it is predicted that total waste generation in Victoria will rise from 12.2 to 20.6 million tonnes per year by 2043.19
Local councils collected 2.1 million tonnes of household garbage, recyclables and green waste, the equivalent of 359kg per person.20
44 per cent of this waste is recovered and recycled, saving 8,000 megalitres of water and more than 463,000 tonnes in greenhouse gases.21
The amount of waste created for every dollar Victoria produces is decreasing. In 2014/15, we produced 34.8 tonnes of waste for every million dollars of gross state product, down from 43.6 tonnes of waste in 2006/07.22
Food that is thrown away wastes money as well as scarce natural resources. Food waste also produces greenhouse gases as it decomposes in landfill.23
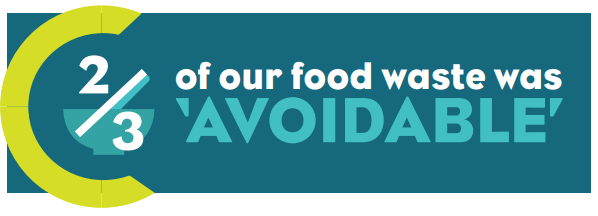
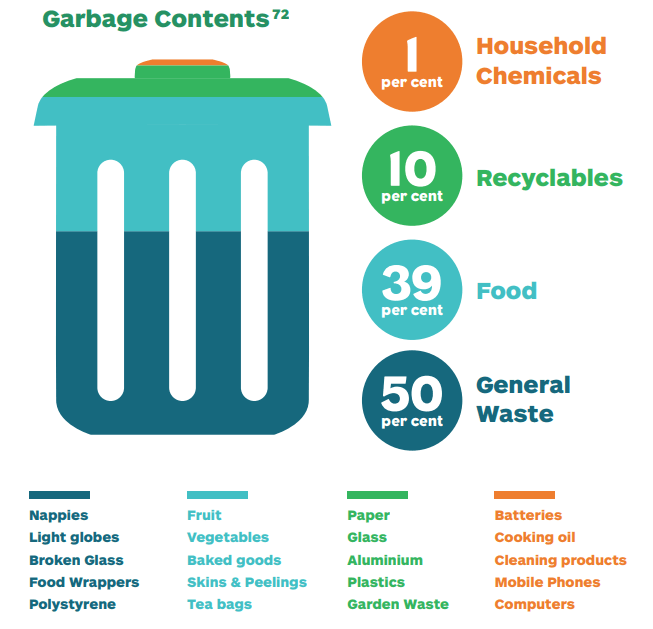
Over one-third of the average household garbage bin in Melbourne is food waste. Two-thirds of this food could have been eaten, and was ‘avoidable’* waste.24
Melbourne's foodbowl is shrinking
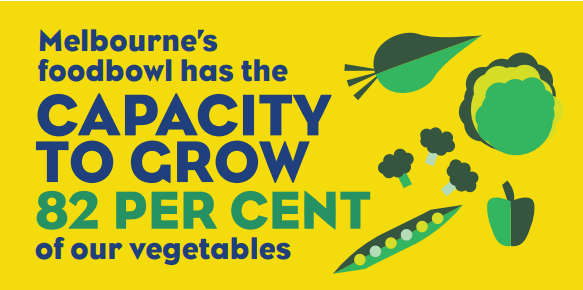
Melbourne’s city fringe foodbowl is an important source of fresh food for the city; producing around 47 per cent of the vegetables grown in Victoria. It has the capacity to grow 82 per cent of Melbourne’s vegetables and 41 per cent of its total food needs.25
Melbourne’s foodbowl is under pressure from:
- climate change
- population growth
- and urban development.26
By 2050, urban sprawl and population growth could reduce the capacity of the foodbowl to meet Greater Melbourne’s food needs to 18 per cent.27
Water needed for food production
It takes more than 475 litres of water per person per day to feed Melbourne.28 Melbourne is likely to experience increasing water scarcity due to climate change and growing demands for water. Recycled water offers an alternative source of water for food production.
In 2015/16, nine per cent of recycled water from Melbourne’s two main water treatment plants was used to produce food.29
Buying food for the household
Food security means having access to sufficient safe and nutritious food for an active and healthy life.
In 2014, around 131,400 people–or three per cent of people living in Greater Melbourne–ran out of food and could not afford to buy more.30
In 2016, 7.8 per cent of people in the City of Melbourne worried about running out of food over the previous 12 months. 4.5 per cent had skipped meals or eaten less because of these worries.31
In 2015, Foodbank provided emergency food relief to 94,802 adults and 38,984 children each month in Victoria.32
Some population groups, such as Aboriginal and Torres Strait Islander peoples, asylum seekers and unemployed people experience higher levels of food insecurity.33
Our rivers and bays
Victoria’s diverse waterways provide drinking water recreation, habitat for animals, as well as support for agriculture and industry. Melbourne has some of the highest quality drinking water in the world.34
We face significant challenges as the climate changes and the population grows. We need safe and affordable water to drink, water to support agriculture and industry, and water for the environment. Victoria requires adaptive strategies that balance the supply and demand of this precious resource–from catchment through to tap and beyond.
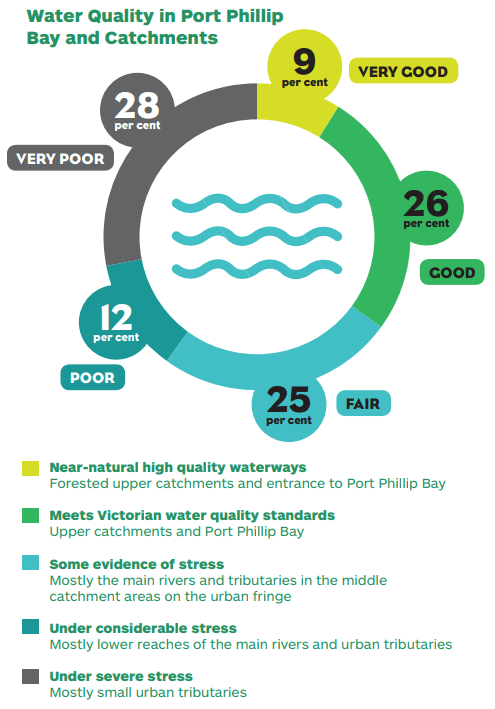
Water quality in port Phillip Bay and catchments
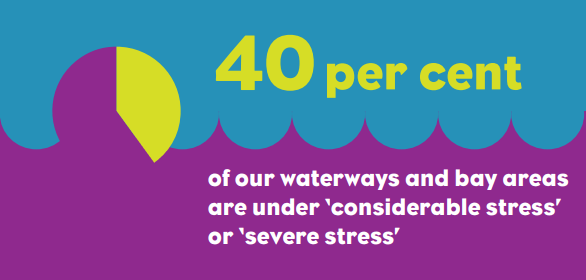
The Yarra River and Port Phillip Bay Report Card monitors the health of the bay and its catchments. Samples from 102 catchment sites and eight marine sites in 2016 were assessed. 40 per cent were under ‘considerable stress’ or ‘severe stress’.35
Water use reducing
The introduction of water restrictions in response to water shortages and drought has been largely supported by Melbourne’s residents. Water use has dropped 22 per cent from ten years ago.36
In 2015/16, residential water use made up 64 per cent of Melbourne’s total water use, the equivalent of 166 litres per person per day.37
References
1 Bureau of Meteorology and CSIRO, “State of the Climate 2016,” 2016. [Online]. Available: http://www.bom.gov.au/state-of-the-climate/ State-of-the-Climate-2016.pdf
2 Bureau of Meteorology and CSIRO, “State of the Climate 2016,” 2016. [Online]. Available: http://www.bom.gov.au/state-of-the-climate/ State-of-the-Climate-2016.pdf
3 N. Hughes, K. Lawson and H. Valle, “Farm Performance and Climate,” May 2017. [Online]. Available: http://data.daff.gov.au/ data/warehouse/9aas/2017/FarmPerformanceClimate/FarmPerformanceClimate_ v1.0.0.pdf
4 Department of Environment, Land, Water and Planning, “Victoria’s Climate Change Adaption Plan 2017-2020,” 2016. [Online]. Available: https://www.climatechange.vic.gov.au/__data/ assets/pdf_file/0024/60729/Victorias-Climate-Change-Adaptation- Plan-2017-2020.pdf
5 Intergovernmental Panel on Climate Change, “Climate Change Synthesis Report,” 2014. [Online]. Available: https://www.ipcc.ch/ report/ar5/syr/
6 L. Hughes and J. Fenwick, “The Burning Issue: Climate Chance and the Australian Bushfire Threat,” 2015. [Online]. Available: https:// www.climatecouncil.org.au/uploads/e18fc6f305c206bdafdcd- 394c2e48d4a.pdf
7 Based on the method used in Bureau of Meteorology, “State of the Climate 2016,” CSIRO, 2016, (Reference 50) using temperature data calculated for Victoria.
8 United States Environmental Protection Agency, “Learn About Heat Islands,” [Online]. Available: https://www.epa.gov/heat-islands/ learn-about-heat-islands
9 Department of the Environment and Energy, “State and Territory Greenhouse Gas Inventories 2015,” May 2017. [Online]. Available: http://www.environment.gov.au/system/files/resources/15d47b77- dee2-42c6-bf2e-6d73e661f99a/files/state-inventory-2015.pdf
Australian Bureau of Statistics, “3101.0 - Australian Demographic Statistics, Jun 2015,” 17 December 2015. [Online]. Available: http://www.abs.gov.au/AUSSTATS/abs@.nsf/allprimarymainfeatures/ 6CBA90A25BAC951DCA257F7F001CC559?opendocument
The World Bank, “World Development Indicators,” 1 July 2017. [Online]. Available: http://data.worldbank.org/data-catalog/world-development- indicators
10 B. Kilkelly, “Technical Expert Meeting on Urban Environment,” 11 June 2014. [Online]. Available: http://unfccc.int/files/bodies/awg/ application/pdf/adp2.5_summary_tem_ue.pdf
11 Department of the Environment and Energy, “State and Territory Greenhouse Gas Inventories 2015,” May 2017. [Online]. Available: http://www.environment.gov.au/system/files/resources/15d47b77- dee2-42c6-bf2e-6d73e661f99a/files/state-inventory-2015.pdf
12 Department of the Environment and Energy, “National Greenhouse Accounts Factors,” August 2016. [Online]. Available: http://www. environment.gov.au/system/files/resources/e30b1895-4870-4a1f- 9b32-3a590de3dddf/files/national-greenhouse-accounts-factors- august-2016.pdf
13 Sustainability Victoria, “The Victorian Households Energy Report,” May 2014. [Online]. Available: http://www.sustainability.vic.gov.au/-/ media/resources/documents/services-and-advice/households/energyefficiency/ rse014-households-energy-report_web.pdf?la=en
14 Sustainability Victoria, “Energy Efficiency Upgrade Potential of Existing Victorian Houses,” December 2015. [Online]. Available: http://www.sustainability.vic.gov.au/-/media/resources/documents/ services-and-advice/households/energyefficiency/retrofit-trials/ energy-efficiency-upgrade-potential-of-existing-victorian-houses- sep-2016.pdf?la=en
15 Clean Energy Council, “Clean Energy Australia Report 2016,” 2017. [Online]. Available: https://www.cleanenergycouncil.org.au/dam/ cec/policy-and-advocacy/reports/2017/clean-energy-australia-report- 2016/CEC_AR_2016_FA_WEB_RES.pdf
16 Australian PV Institute, “Mapping Australian Photovoltaic Installations,” 5 September 2017. [Online]. Available: http://pv-map.apvi. org.au/historical#4/-26.67/134.12
17 Environmental Protection Authority Victoria, “Melbourne’s Air Quality,” 7 January 2016. [Online]. Available: http://www.epa.vic.gov.au/ your-environment/air/melbournes-air-quality
18 Environmental Protection Authority Victoria, “PM10 Particles in Air,” 20 December 2016. [Online]. Available: http://www.epa.vic.gov.au/ your-environment/air/air-pollution/pm10-particles-in-air
19 Sustainability Victoria, “Victorian Market Development Strategy for Recovered Resources,” May 2016. [Online]. Available: http://www. sustainability.vic.gov.au/-/media/resources/documents/our-priorities/ integrated-waste-management/victorian-market-development- strategymay16.pdf?la=en
20 Australian Bureau of Statistics, “3101.0 - Australian Demographic Statistics, Jun 2015,” 17 December 2015. [Online]. Available: http://www.abs.gov.au/AUSSTATS/abs@.nsf/allprimarymainfeatures/ 6CBA90A25BAC951DCA257F7F001CC559?opendocument
Sustainability Victoria, “Victorian Local Government Annual Waste Services Report 2014-2015,” 2016. [Online]. Available: http://www. sustainability.vic.gov.au/publications-and-research/research/victorian- waste-and-recycling-data-results-201415/victorian-local-government- annual-waste-services-report-201415
21 Sustainability Victoria, “Victorian Local Government Annual Waste Services Report 2014-2015,” 2016. [Online]. Available: http://www. sustainability.vic.gov.au/publications-and-research/research/victorian- waste-and-recycling-data-results-201415/victorian-local-government- annual-waste-services-report-201415
22 Sustainability Victoria, “Victorian Recycling Industry Annual Report,” December 2016. [Online]. Available: http://www.sustainability. vic.gov.au/publications-and-research/research/victorian- waste-and-recycling-data-results-201415/victorian-recycling-industry- annual-report-201415
23 L. Mason, T. Boyle, J. Fyfe, T. Smith and D. Cordell, “National Food Waste Assessment,” June 2011. [Online]. Available: http://www. environment.gov.au/system/files/resources/128a21f0-5f82-4a7db49c- ed0d2f6630c7/files/food-waste.pdf
24 Sustainability Victoria, “Victorian Statewide Garbage Bin Audits: Food, Household Chemicals and Recyclables 2013,” 2014. [Online]. Available: http://www.sustainability.vic.gov.au/-/media/resources/ documents/publications-and-research/research/bin-audits/victorian- statewide-garbage-bin-audit.pdf?la=en
25 R. Carey, K. Larsen and J. Sheridan, “Melbourne’s Food Future: Planning a Resilient City Foodbowl,” 2016. [Online]. Available: http:// veil.msd.unimelb.edu.au/__data/assets/pdf_file/0010/2355148/ Foodprint-Melbourne-summary-briefing.pdf
26 R. Carey, K. Larsen and J. Sheridan, “Melbourne’s Food Future: Planning a Resilient City Foodbowl,” 2016. [Online]. Available: http:// veil.msd.unimelb.edu.au/__data/assets/pdf_file/0010/2355148/ Foodprint-Melbourne-summary-briefing.pdf
27 R. Carey, K. Larsen and J. Sheridan, “Melbourne’s Food Future: Planning a Resilient City Foodbowl,” 2016. [Online]. Available: http:// veil.msd.unimelb.edu.au/__data/assets/pdf_file/0010/2355148/ Foodprint-Melbourne-summary-briefing.pdf
28 J. Sheridan, R. Carey and S. Candy, “Melbourne’s Food Future: What Does it Take to Feed a City,” June 2016. [Online]. Available: http:// veil.msd.unimelb.edu.au/__data/assets/pdf_file/0005/2355449/ Foodprint-Melb-What-it-takes-to-feed-a-city.pdf
29 Melbourne Water, “Enhancing Life and Liveability: Annual Report 2015-2016,” 2016. [Online]. Available: https://www.melbournewater. com.au/aboutus/reportsandpublications/Annual-Report/Documents/ Annual-Report-2016.pdf
30 Department of Health and Human Services, “Victorian Population Health Survey - Food Insecurity,” Victorian Health Information Surveillance System, 10 February 2017. [Online]. Available: https:// hns.dhs.vic.gov.au/3netapps/vhisspublicsite/ReportParameter. aspx?ReportID=56&TopicID=1&SubtopicID=17
Australian Bureau of Statistics, “3218.0 - Regional Population Growth, Australia, 2013-14,” 31 March 2015. [Online]. Available: http://www.abs.gov.au/AUSSTATS/abs@.nsf/Lookup/3218.0Main+- Features12013-14?OpenDocument
31 City of Melbourne, “Indicators of Wellbeing by Year (Future Melbourne),” 31 May 2017. [Online]. Available: https://data.melbourne. vic.gov.au/People-Events/Indicators-of-wellbeing-by-year-Future- Melbourne-/khvg-gtaq
32 FoodBank, “Fighting Hunger in Australia,” 2016. [Online]. Available: http://www.foodbank.org.au/wp-content/uploads/2016/05/Foodbank- Hunger-Report-2016.pdf
33 R. Lindberg, M. Lawrence, L. Gold, S. Friel and O. Pegram, “Food Insecurity in Australia: Implications for General Practitioners,” Australian Family Physician, vol. 44, no. 11, pp. 859-862, 2015.
34 Melbourne Water, “Water Quality,” [Online]. Available: https://www. melbournewater.com.au/whatwedo/supply-water/pages/water- quality.aspx.
35 Department of Environment, Land, Water and Planning, “Report Card 2015-2016,” 4 May 2017. [Online]. Available: http://yarraandbay. vic.gov.au/report-card/report-card-2016
36 Melbourne Water, “Water Outlook for Melbourne,” 1 December 2016. [Online]. Available: https://www.melbournewater.com.au/ waterdata/Documents/Water-outlook-Melbourne2016.pdf
37 Melbourne Water, “Water Outlook for Melbourne,” 1 December 2016. [Online]. Available: https://www.melbournewater.com.au/ waterdata/Documents/Water-outlook-Melbourne2016.pdf