The current situation
The important early years
The early years are a stage of rapid growth and development.
 4
4
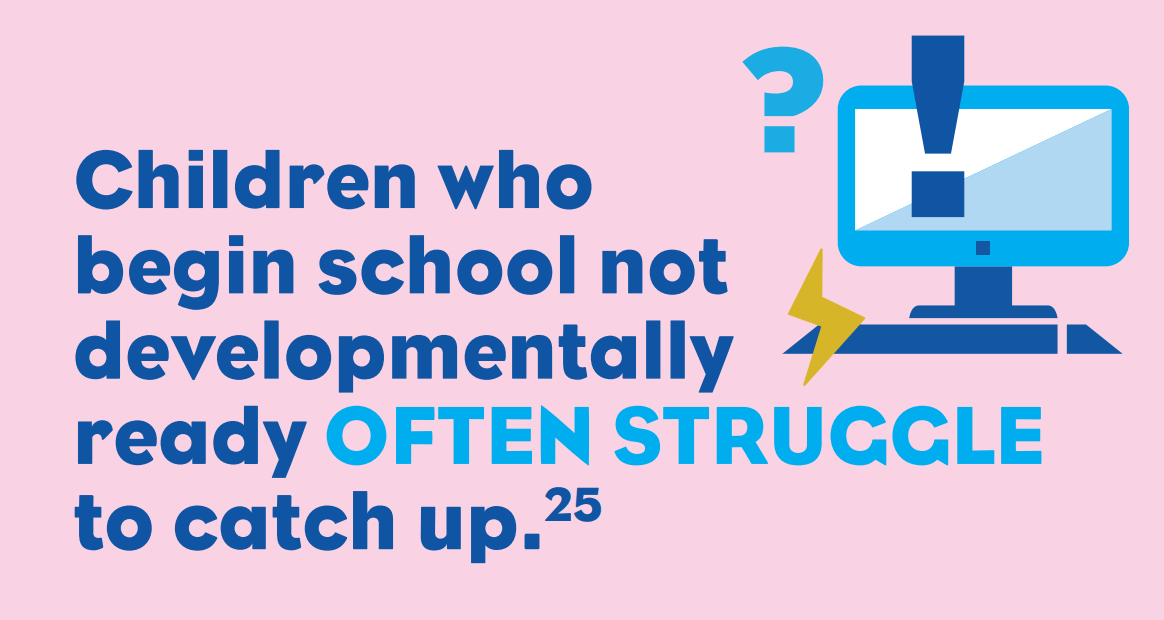
One in five preschool children are vulnerable in at least one of the following attributes:
- Physical health
- Social competence
- Emotional maturity
- Language / cognitive skills
- Communication skills / general knowledge5
Attending kindergarten for 15 hours a week gives most children a stronger start at school. Children from disadvantaged backgrounds may benefit from more hours or more regular attendance.6
95 per cent of Victorian children attend preschool and the number of hours children attend is increasing. In 2015, 70 per cent of pre-school aged children attended a program for 15 hours or more compared with 29 per cent in 2012.7
A sense of belonging
 8
8
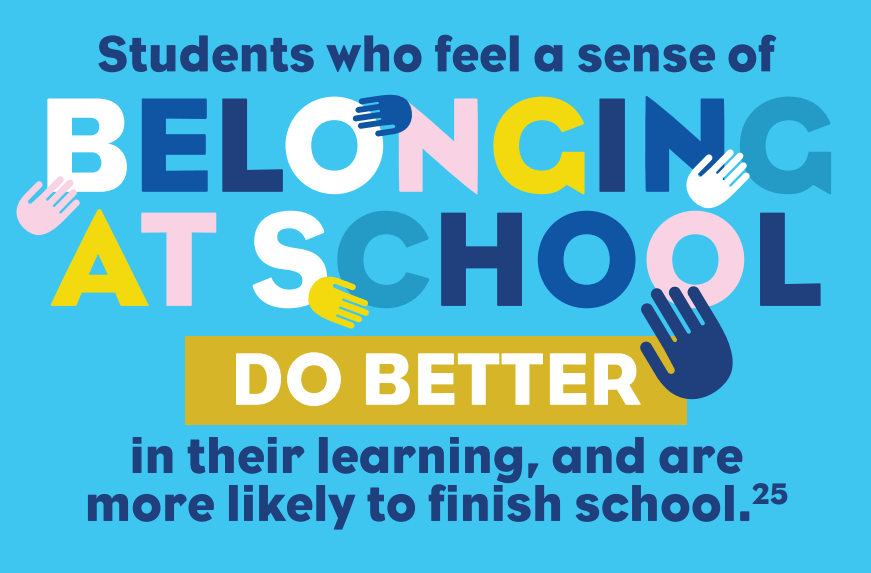
63 per cent of students in Years 7–9 feel connected with their school.9
Testing skills at school
Each year, students in Years 3, 5, 7 and 9 are tested on their reading, writing, spelling, grammar and numeracy as part of the National Assessment Program – Literacy and Numeracy (NAPLAN).
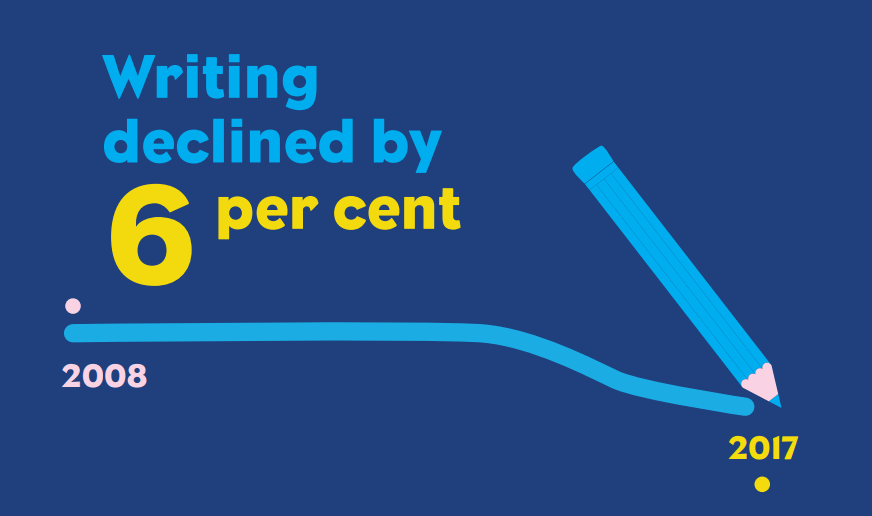
In 2017, Victoria’s Year 9 results were stable in most areas, except for ‘Writing’ which declined by six percentage points from 2008.10
As part of the Programme for International Student Assessment (PISA) assessment in 2015, students were tested in science, maths, reading, collaborative problem-solving and financial literacy. This provides an indication of how Australia’s future ‘STEM’ skills—science, technology, engineering and mathematics—are progressing. STEM skills are vital in our increasingly technological world.11
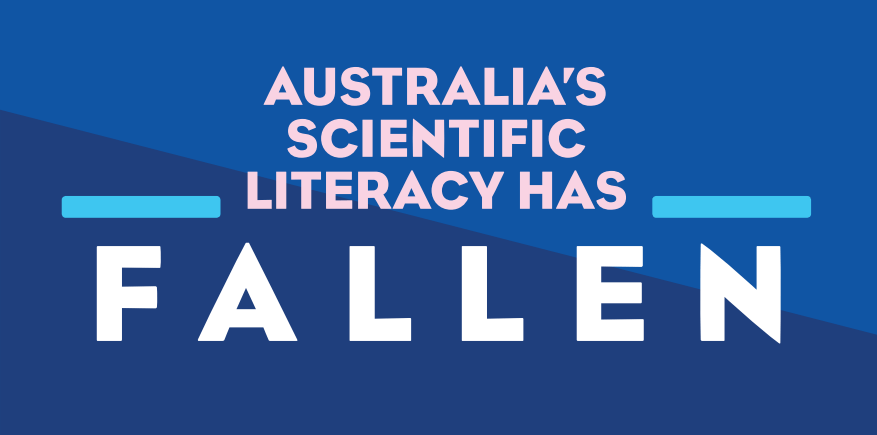
In Victoria, average scientific literacy was relatively unchanged between PISA 2006 and 2015. However, 37 per cent of 15 year-old students in Victoria did not meet the National Proficiency Standard in science.12
Although Australia’s scientific literacy ‘score’ is above the OECD average, it has been in decline since reliable testing commenced; falling three percentage points since 2006.13
Indigenous scientific literacy has remained steady since 2006 but remains below the OECD average. Current results are 15 per cent lower than the performance scores of non-indigenous students; representing approximately two-and-a-half years of schooling.14
Most students complete Year 12

82 per cent of 20-year olds have completed Year 12 or its equivalent.38 This compares with completion rates below 55 per cent for those born prior to 1965.15
Across Victoria, one third of all Indigenous people had completed Year 12 compared to two-thirds of non-Indigenous Victorians.16
Youth unemployment is high
13.5 per cent of young Victorians aged 15-24 are unemployed.17
This compares with 6.1 per cent overall unemployment in Victoria.18
16 per cent of early school leavers in Victoria did not find work within six months of leaving school. For Indigenous Victorians, this number is much higher, with 25 per cent of early school leavers unemployed after six months.19
New graduates struggle in job market
One-third of new bachelor degree graduates seeking full-time employment were unable to find a position within four months of completing their course.20
Science graduates were worse off, with 50 per cent unable to find full-time employment after four months. Half of the science graduates who did find work said their qualification was not required for their job.21
Older workers still working

55 per cent of people aged 60-64 have a paid job. This compares with 45 per cent a decade ago.
.png.aspx) 22
22
Workforce participation for 60-64 year olds has steadily increased since the late 1990’s. It is more than double the participation rate of 1985.23
Financial security is the most common factor influencing a person’s decision to retire.24
While nearly half of today’s retirees depend on the pension, only 27 per cent of people who are over 45 and still working expect the pension to be their main source of income when they retire.25
Melbourne's future job market
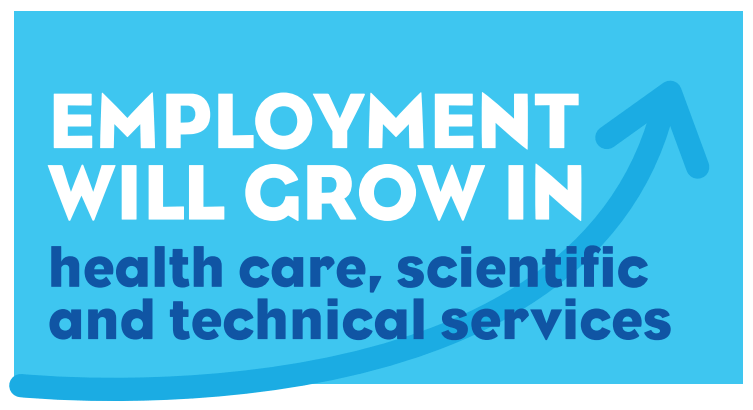
Employment is expected to increase most in health care and social assistance, and professional, scientific and technical services.26
Employment in manufacturing is continuing to decline from its peak in 2010, when it provided the highest number of jobs in Greater Melbourne.27
It is estimated that two-thirds of children entering primary school today will work in jobs that do not yet exist.48 Key skills for the future job market include problem-solving, critical and creative thinking, and STEM skills.28
References
1 Department of Education and Training, “Schools and Enrolments,” February 2017. [Online]. Available: http://www.education.vic.gov.au/ Documents/about/department/schoolsandenrolments.xlsx
2 Universities Australia, “University Profiles,” 4 April 2016. [Online]. Available: https://www.universitiesaustralia.edu.au/australias-universities/university-profiles#.Wa4wZ4R96Ul Department of Education and Training, “2017 Detailed Monthly Tables,” 2017. [Online]. Available: https://internationaleducation. gov.au/research/International-Student-Data/Documents/INTERNATIONAL%20STUDENT%20DATA/2017/2017May_0712.pdf
3 National Scientific Council on the Developing Child, “Building the Brain’s “Air Traffic Control” System,” 2011. [Online]. Available: http:// www.ncsl.org/documents/cyf/WorkingPaper11.pdf
4 S. Lamb, J. Jackson, A. Walstab and S. Huo, “Educational Opportunity in Australia 2015,” October 2015. [Online]. Available: http:// www.mitchellinstitute.org.au/wp-content/uploads/2015/11/Educational-opportunity-in-Australia-2015-Who-succeeds-and-who-misses-out-19Nov15.pdf
5 Australian Early Development Census, “Public Table by Local Government Area (LGA) 2009-2015,” 2016. [Online]. Available: http:// www.aedc.gov.au/Websilk/Handlers/SecuredDocument.ashx?id=fcf52664-db9a-6d2b-9fad-ff0000a141dd
6 M. O’Connell, S. Fox, B. Hinz and H. Cole, “Quality Early Education for All: Fostering Creative, Entrepreneurial, Resilient and Capable Learners,” April 2016. [Online]. Available: http://www.mitchellinstitute.org.au/wp-content/uploads/2016/04/Quality-Early-Education-for-All-FINAL.pdf
7 Australian Bureau of Statistics, “4240.0 - Preschool Education, Australia, 2016,” 8 March 2017. [Online]. Available: http://www.abs.gov. au/AUSSTATS/abs@.nsf/allprimarymainfeatures/7763A80C0386A- 792CA2580DC00152A33?opendocument
Department of Education and Training, “Kindergarten Participation Rate,” July 2015. [Online]. Available: http://www.education.vic.gov. au/Documents/about/research/VCAMS_Indicator_31_1a.xlsx
Australian Bureau of Statistics, “4240.0 - Preschool Education, Australia, 2015,” 18 March 2016. [Online]. Available: http://www.abs.gov. au/AUSSTATS/abs@.nsf/Lookup/4240.0Main+Features12015?OpenDocument
Australian Bureau of Statistics, “4240.0 - Preschool Education, Australia, 2012,” 13 March 2013. [Online]. Available: http://www.abs.gov. au/AUSSTATS/subscriber.nsf/log?openagent&42400do001_2012. xls&4240.0&Data%20Cubes&9FEB716F161CFCF6CA257B2C000F- 611B&0&2012&13.03.2013&Latest
8 S. Lamb, J. Jackson, A. Walstab and S. Huo, “Educational Opportunity in Australia 2015,” October 2015. [Online]. Available: http:// www.mitchellinstitute.org.au/wp-content/uploads/2015/11/Educational-opportunity-in-Australia-2015-Who-succeeds-and-who-misses-out-19Nov15.pdf
9 Department of Education and Training, “Proportion of Students Who Report Feeling Connected with Their School,” July 2015. [Online]. Available: http://www.education.vic.gov.au/Documents/about/ research/VCAMS_Indicator_10_6.xlsx
10 Australian Curriculum, Assessment and Reporting Authority, “National Assessment Program,” 2016. [Online]. Available: http:// reports.acara.edu.au/Home/Results#results Australian Curriculum, Assessment and Reporting Authority, “National Assessment Program,” 2017. [Online]. Available: http:// reports.acara.edu.au/NAP/NaplanResults
11 S. Thomson, L. De Bortoli and C. Underwood, “PISA 2015: Reporting Australia’s Results,” 15 March 2017. [Online]. Available: http:// research.acer.edu.au/cgi/viewcontent.cgi?article=1023&context=ozpisa
12 S. Thomson, L. De Bortoli and C. Underwood, “PISA 2015: Reporting Australia’s Results,” 15 March 2017. [Online]. Available: http:// research.acer.edu.au/cgi/viewcontent.cgi?article=1023&context=ozpisa
13 Organisation for Economic Co-operation and Development, “PISA 2015 Results in Focus,” 2016. [Online]. Available: https://www.oecd. org/pisa/pisa-2015-results-in-focus.pdf
S. Thomson, J. Cresswell and L. De Bortoli, “Facing the Future: A Focus on Mathematical Literacy Among Australian 15-year-old Students in PISA 2003,” 2004. [Online]. Available: https://www.acer. org/files/PISA_screen.pdf
14 S. Thomson, L. De Bortoli and C. Underwood, “PISA 2015: Reporting Australia’s Results,” 15 March 2017. [Online]. Available: http:// research.acer.edu.au/cgi/viewcontent.cgi?article=1023&context=ozpisa
15 Australian Bureau of Statistics, “TableBuilder 2016 Census - Employment, Income and Education,” 6 September 2017. [Online]. Available: https://auth.censusdata.abs.gov.au/webapi/jsf/tableView/tableView.xhtml#
16 Australian Bureau of Statistics, “Victoria - Aboriginal and Torres Strait Islander Peoples Profile,” 2017 June 2017. [Online]. Available: http://www.censusdata.abs.gov.au/CensusOutput/copsub2016. NSF/All%20docs%20by%20catNo/2016~Community%20Profile~2/$- File/IP_2.zip?OpenElement
17 Australian Bureau of Statistics, “6202.0 Labour Force, Australia, Jul 2017,” 17 August 2017. [Online]. Available: http://www. abs.gov.au/ausstats/meisubs.NSF/log?openagent&6202016. xls&6202.0&Time%20Series%20Spreadsheet&7F58C5F89E21B4D- 5CA25817E0013E6E1&0&Jul%202017&17.08.2017&Latest
18 Australian Bureau of Statistics, “Table 5. Labour Force Status by Sex, Victoria,” 15 June 2017. [Online]. Available: http://www. abs.gov.au/ausstats/meisubs.NSF/log?openagent&6202005. xls&6202.0&Time%20Series%20Spreadsheet&2A97CB46714F3CEECA25813F00122583&0&
May%202017&15.06.2017&Latest
19 Department of Education and Training, “Percentage of Early School Leavers who are Unemployed Six Months on After Leaving School,” July 2015. [Online]. Available: http://www.education.vic.gov.au/ Documents/about/research/VCAMS_Indicator_16_3.xlsx
20 Graduate Careers Australia, “Grad Stats,” December 2015. [Online]. Available: http://www.graduatecareers.com.au/wp-content/uploads/2015/12/GCA_GradStats_2015_FINAL.pdf
21 A. Norton, “Mapping Australian Higher Education 2016,” Grattan Institute, 7 August 2016. [Online]. Available: https://grattan.edu.au/ report/mapping-australian-higher-education-2016/
22 Australian Bureau of Statistics, “Table 01. Labour Force Status by Age, Social Marital Status, and Sex,” August 2017. [Online]. Available: http://www.abs.gov.au/AUSSTATS/ABS@Archive.nsf/ log?openagent&6291001.xls&6291.0.55.001&Time%20Series%20 Spreadsheet&D8BAD996102AC27BCA2581A10022103A&0&Aug%20 2017&21.09.2017&Latest
23 Australian Bureau of Statistics, “Table 01. Labour Force Status by Age, Social Marital Status, and Sex,” August 2017. [Online]. Available: http://www.abs.gov.au/AUSSTATS/ABS@Archive.nsf/ log?openagent&6291001.xls&6291.0.55.001&Time%20Series%20 Spreadsheet&D8BAD996102AC27BCA2581A10022103A&0&Aug%20 2017&21.09.2017&Latest
24 Australian Bureau of Statistics, “Australians Intend to Work Longer Than Ever Before,” 29 March 2016. [Online]. Available: http://www. abs.gov.au/ausstats/abs@.nsf/mediareleasesbyCatalogue/C01D5E- 3F3A934E99CA257F80001564DE?OpenDocument
25 Australian Bureau of Statistics, “Australians Intend to Work Longer Than Ever Before,” 29 March 2016. [Online]. Available: http://www. abs.gov.au/ausstats/abs@.nsf/mediareleasesbyCatalogue/C01D5E- 3F3A934E99CA257F80001564DE?OpenDocument
26 Department of Employment, “Employment Projections for the Five Years to November 2020,” 4 April 2017. [Online]. Available: http:// lmip.gov.au/PortalFile.axd?FieldID=2787737&.xlsm
27 Department of Employment, “Employment Projections for the Five Years to November 2020,” 4 April 2017. [Online]. Available: http:// lmip.gov.au/PortalFile.axd?FieldID=2787737&.xlsm
28 World Economic Forum, “Chapter 1: The Future of Jobs and Skills,” January 2016. [Online]. Available: http://reports.weforum.org/ future-of-jobs-2016/chapter-1-the-future-of-jobs-and-skills/#view/ fn-1
The Foundation for Young Australians, “The New Work Smarts: Thriving in the New World Order,” July 2017. [Online]. Available: https://www.fya.org.au/wp-content/uploads/2017/07/FYA_TheNewWorkSmarts_July2017.pdf